
Patent cost in saved analysis
All platinum users will now benefit from the ‘estimated patent cost’ in saved analysis.
This new information will be particularly useful when looking at a company portfolio and identifying in which technological domain they are estimated to spend the most next year (as shown below).
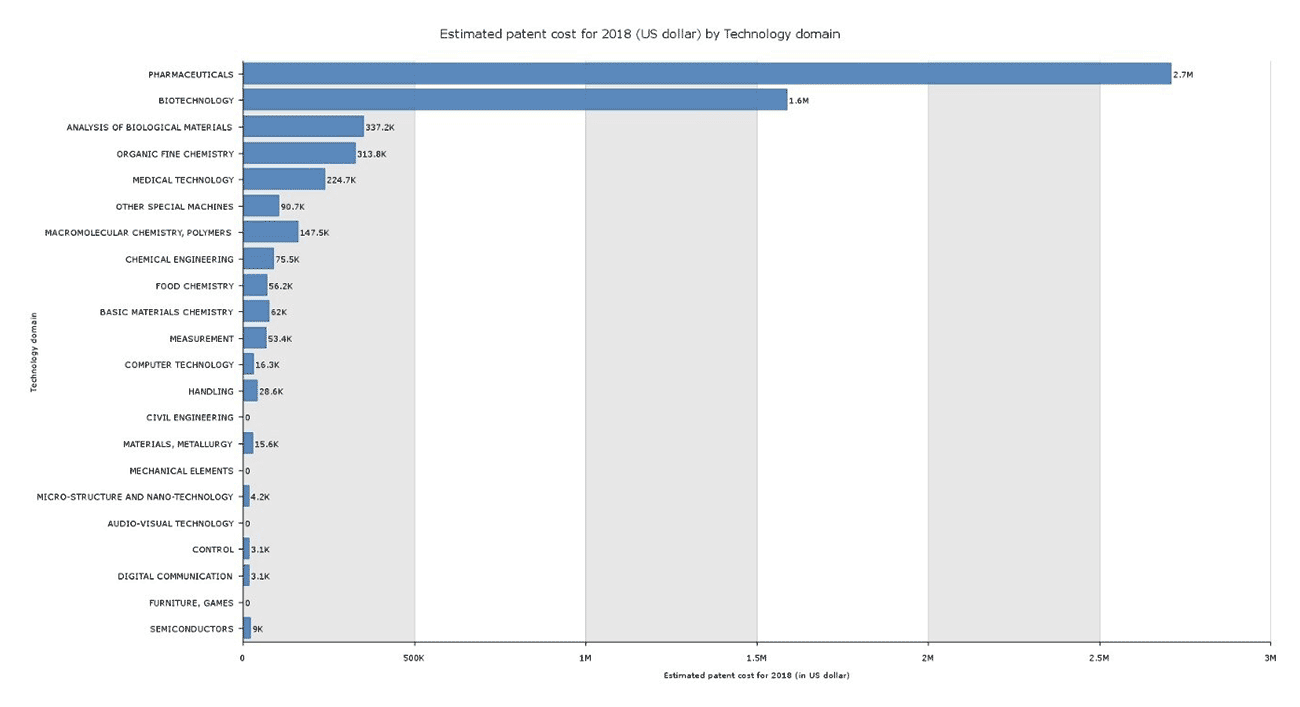
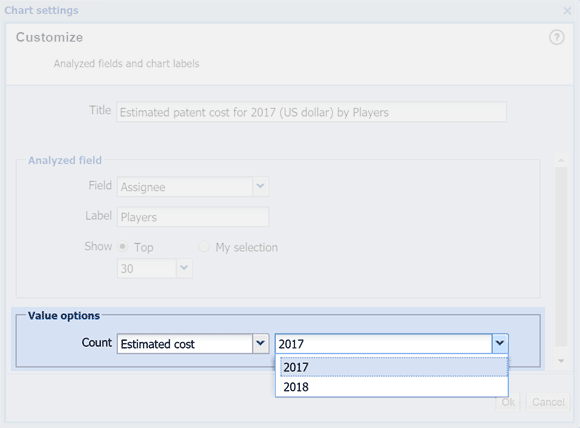
To generate such graph, simply select the ‘Estimated cost’ in the chart settings pop-up and the desired year.
Using advanced charts such as tabular allows you to compare assignees and as we can see below, estimated cost is not always proportional to the number of alive patent families.

Chart title modification
To improve chart comprehension, all analysis titles have been enhanced to integrate more information. As we can see below, both field (Inventor) and value option (Estimated cost) are present.
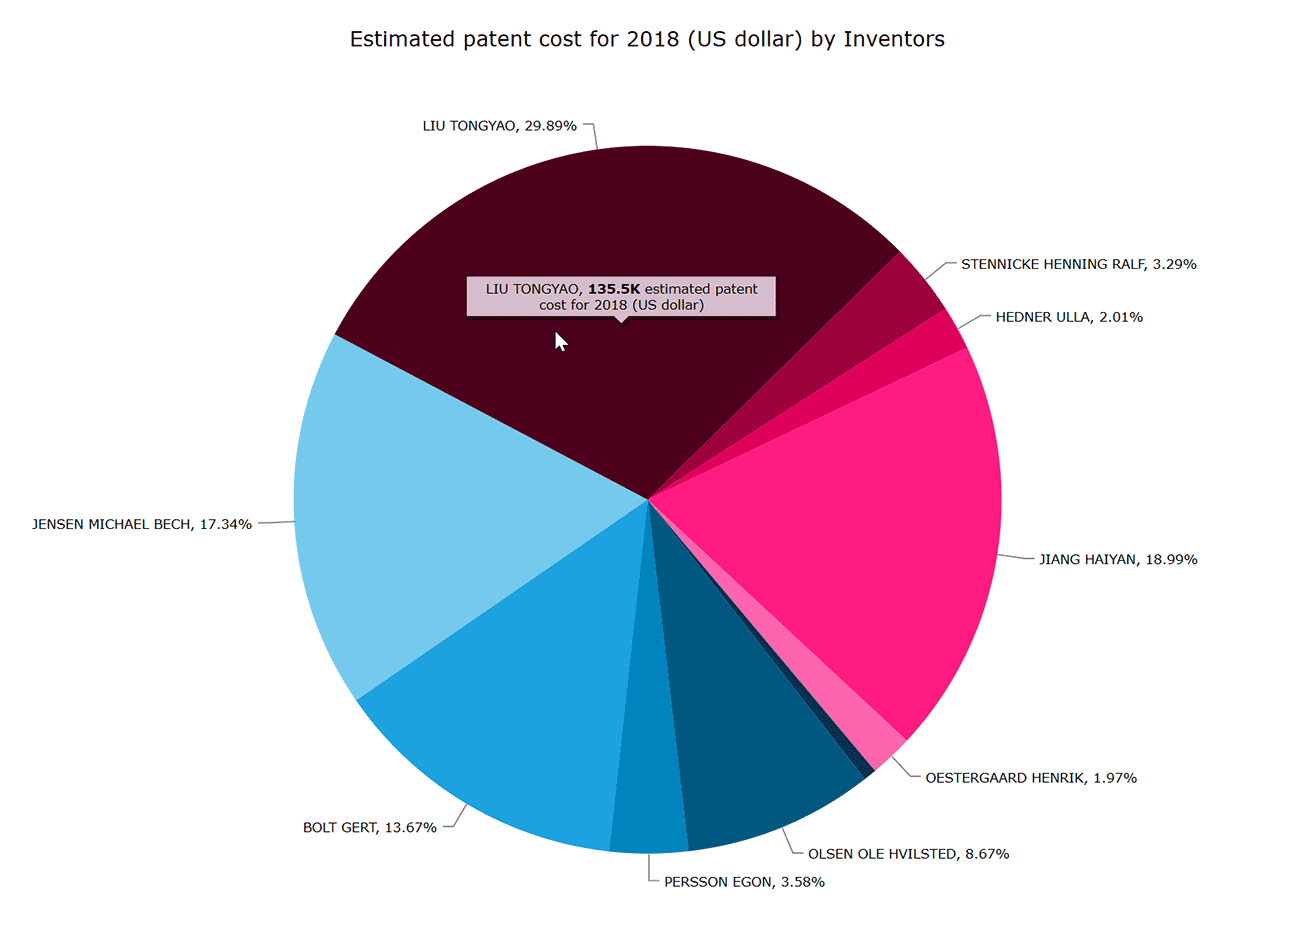
Here we can see for a given company which inventor’s portfolio is expected to cost the most next year.